 Singular Spectrum Analysis

Singular-spectrum analysis (SSA) is a powerful technique of time series analysis and forecasting. Let us briefly describe the main idea of the basic version of SSA.
Let x1,x2, ..., xN be a time series of length N. Given a window length L (1 < L < N), we construct the L-lagged vectors Xi=(xi,...,xi+L-1)T, 1 <= i <= K=N-L+1, and compose them into one matrix X=[X1:...:XK] of size L ×K. This matrix is Hankel and has entries xij=xi+j-2.
The columns Xj of X, considered as vectors, lie in the L-dimensional space RL. The singular value decomposition of the matrix X XT provides us with a collection of L eigenvalues and eigenvectors. A particular combination of a certain number l < L of these eigenvectors determines an l-dimensional subspace in RL. The L-dimensional data is then projected onto this l-dimensional subspace and the subsequent averaging over the diagonals gives us an approximation to the original series. The reconstructed series satisfies some linear recurrent formula which we may use to forecast the original series.
SSA can be used for smoothing, filtration, noise reduction, extraction of trends of different resolution, extraction of periodicities in the form of modulated harmonics, change-point detection and other tasks, see Book. It can also be used for the analysis and forecasting of multivariate time series and can help in finding causality between series.
The SSA software we use to plot and forecast the temperature data can be found at Caterpillar SSA website.
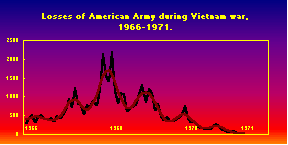
As an example, the picture above illustrates a reconstruction
of the US Army losses in Vietnam war time series by their first 3
principal components.
The main interest is in various applications and studying the perfomance characteristics of the technique, especially, in change-pont detection problems.
Goljandina N.E., Nekrutkin V.V., Zhigljavsky A.A. (2001) Analysis of Time Series Structure: SSA and related techniques. Chapman and Hall/CRC, xii+306pp
Danilov D., Zhigljavsky A.A., ed. (1997) Principal Components of Time Series: The Caterpillar Method. University of St.Petersburg, 308 pp.
Hassani H. and Zhigljavsky A.(2009) Singular Spectrum Analysis: Methodology and Application to Economics Data, Journal of Systems Science and Complexity, v. 22, No. 3, p. 372-394.
Hassani H., Heravi S. and Zhigljavsky A. (2009) Forecasting European Industrial Production with Singular Spectrum Analysis, International Journal of Forecasting, 25, No. 1, p. 103-118.
Hassani H., and Soofi A. and Zhigljavsky A. (2009) Predicting Daily Exchange Rate with Singular Spectrum Analysis, Nonlinear Analysis: Real World Applications (to appear)